

Exercise 1: Build a GeoDataFrame
Create a GeoDataFrame of two points, A at (7.4, 46.9) and B at (8.5, 47.4), in EPSG:4326. Print the epsg code and the geometry column.
# Your solution hereExercise 2: Write and read GeoJSON
Write the GeoDataFrame from exercise 1 to _files/points.geojson, read it back, and confirm the shape and that the crs is preserved.
# Your solution hereExercise 3: Reproject
Reproject the points to EPSG:2056 and print the new epsg code and the projected coordinates of point A (in metres, rounded to the nearest metre).
# Your solution hereExercise 4: Measure correctly
Compute the distance between A and B in kilometres. Reproject to EPSG:2056 first, and state in a comment why measuring in EPSG:4326 would be wrong.
# Your solution hereExercise 5: Spatial join
Given the polygon below (EPSG:4326), use sjoin with the within predicate to find which of the two points lie inside it.
from shapely.geometry import Polygon
poly = gpd.GeoDataFrame({"zone": ["z"]},
    geometry=[Polygon([(7, 46.5), (8, 46.5), (8, 47.5), (7, 47.5)])], crs="EPSG:4326")
# Your solution hereExercise 6: Buffer and area
Reproject the points to EPSG:2056, buffer each by 10 km, and print the area of one buffer in km² (it should be close to the analytical value pi times 10² = 314 km²).
# Your solution hereExercise 7: Dissolve
Create a GeoDataFrame of two adjacent polygons that share the attribute type = "flood", then dissolve by that attribute and confirm the result is a single merged polygon.
# Your solution hereExercise 8: Hurricane track analysis
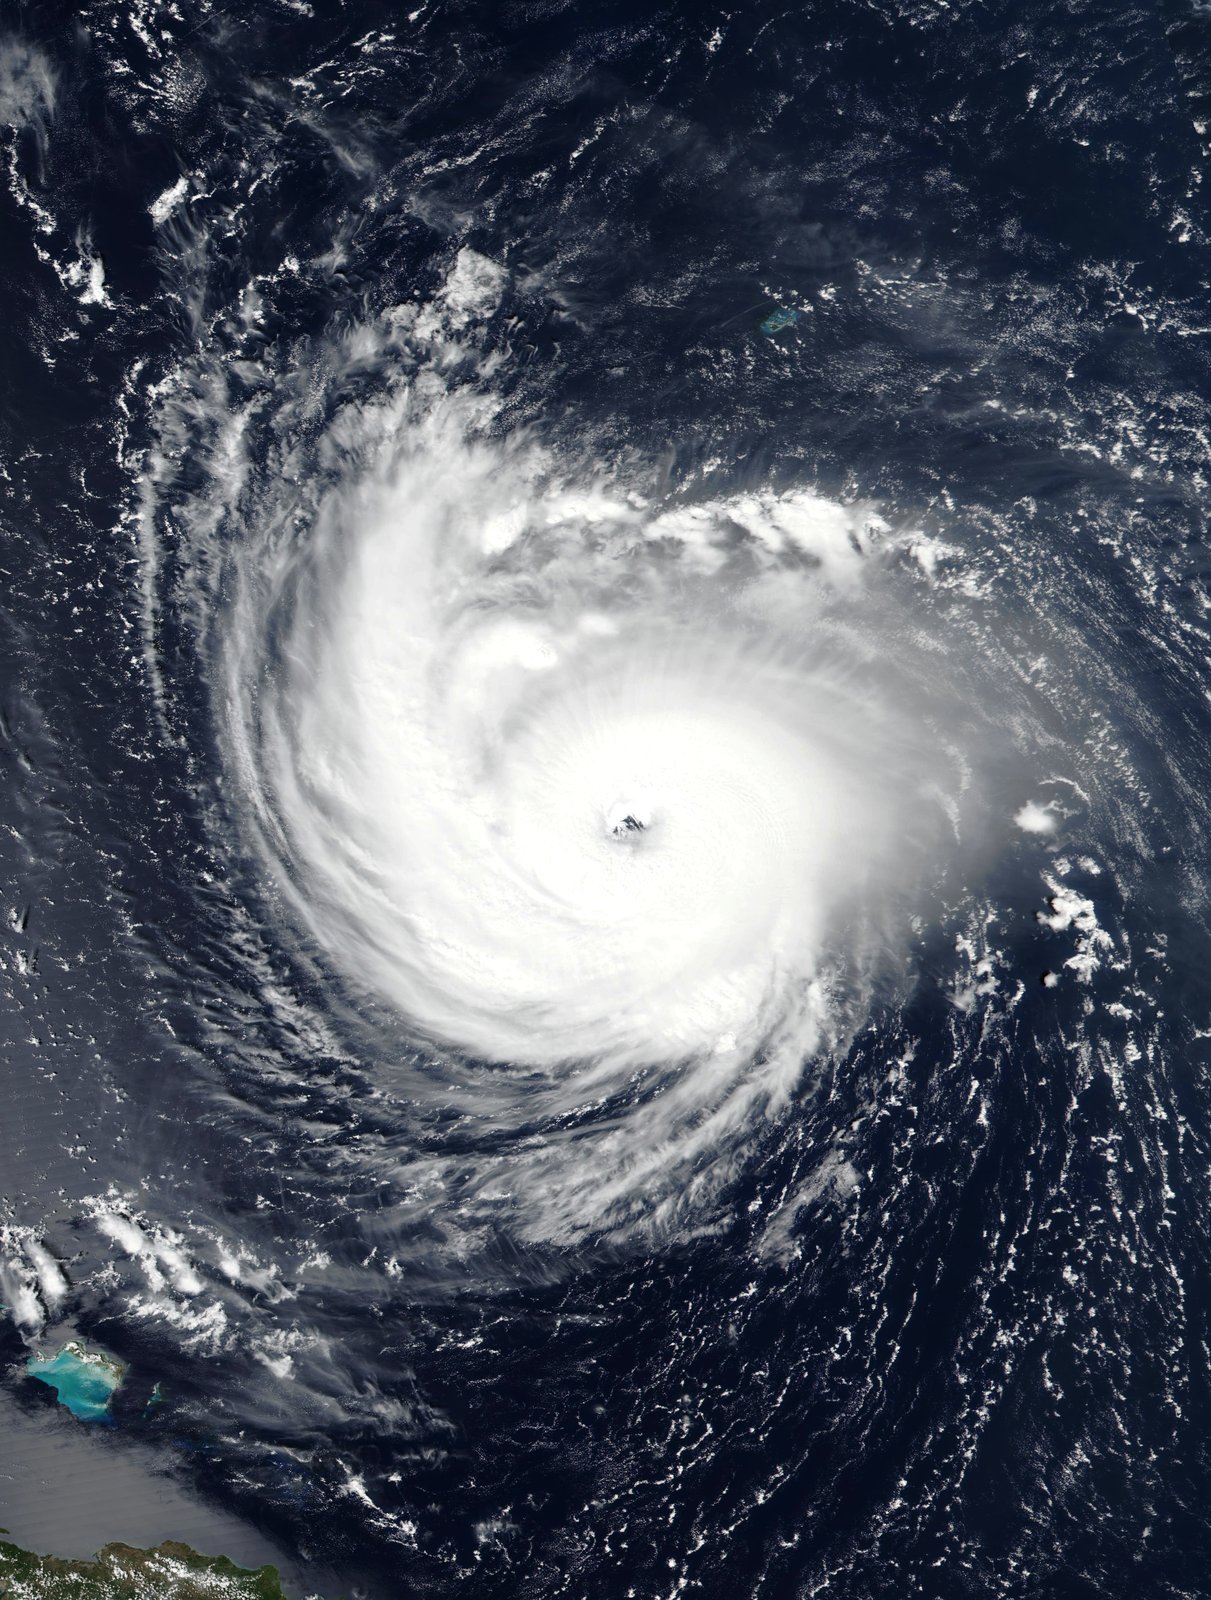
Figure 1:Hurricane Florence on 11 September 2018, three days before landfall in North Carolina. Image from NASA Worldview via Wikimedia Commons, public domain.
Can you quickly find out which US states Hurricane Florence passed through using geopandas?
Apply geopandas to read in the geospatial data, plot, and analyse the track of Hurricane Florence from 30 August to 18 September 2018. The track is the archived advisory record from the National Hurricane Center; the state boundaries are a US Census Bureau cartographic boundary file.
References:
Introduction to GeoPandas — geopandas’ official website
Geopandas: an introduction — Automating GIS Processes
Use Data for Earth and Environmental Science in Open Source Python
# Pre-supplied: download and cache the two real data files.
import pooch

states_path = pooch.retrieve(
    url="https://raw.githubusercontent.com/gse-unil/2026_MLEES_book/main/data/part-I/gz_2010_us_040_00_5m.json",
    known_hash="sha256:7a8c022e063a34a83f35984cde6c81992ece5983f8cc4459ed02e40687739573",
    fname="us_states.geojson",
    path=pooch.os_cache("mlees"),
)
track_path = pooch.retrieve(
    url="https://raw.githubusercontent.com/gse-unil/2026_MLEES_book/main/data/part-I/florence.csv",
    known_hash="sha256:385691583ee41682a1c905e042c56ea362609fb04645934bdda7911c55c8b63f",
    fname="florence.csv",
    path=pooch.os_cache("mlees"),
)Q1) Import geopandas and pandas.
Import geopandas as gpd, pandas as pd, and matplotlib’s pyplot as plt.
# Import geopandas (as gpd), pandas, and matplotlibQ2) Read the state boundary file with geopandas’ read_file function.
The file is cached at states_path. Call the result country.
# Read the data with the geopandas functionQ3) Have a look at the data. What type of geometries does it contain?
Print the first few rows, and answer the geometry question in a comment.
# Print out the first few lines of the dataQ4) Have a look at the data on a map using geopandas’ .plot() method.
Exclude Alaska and Hawaii using the NAME attribute and pandas’ .isin() method. Specify the
figsize to be 30 x 20.
# Plot the US states (Alaska and Hawaii excluded)# Pre-supplied: read in the hurricane Florence data, drop the advisory bookkeeping columns,
# fix the longitude sign, and have a look at the dataframe.
# The Long column holds a positive "degrees west" magnitude, not a signed longitude -- a common
# quirk of NHC advisory data.
florence = pd.read_csv(track_path)
florence = florence.drop(["AdvisoryNumber", "Forecaster", "Received"], axis=1)
florence["Long"] = 0 - florence["Long"]
florence.head(3)Q5) Create a GeoDataFrame from the florence DataFrame.
Build the geometry column from the Long and Lat columns with
gpd.points_from_xy,
and call the result gdf_florence. Then look at its first few rows.
# Create a geodataframe from the hurricane florence dataframeQ6) Plot the US states map (without Alaska and Hawaii) and hurricane Florence together.
Draw the states as a base map, then plot the hurricane positions on top in a colour that stands out.
# Plot to see the hurricane overlay the US map, with the hurricane position on topQ7) What is the coordinate reference system of the data?
Check it for both layers, and say in a comment whether they match — two layers only line up on one pair of axes if they share a crs.
# Check the coordinate reference system of the dataQ8) Which states did the hurricane pass through?
# Plot the US states without Alaska and Hawaii, then
# annotate the US states with their names, then
# select the hurricane trajectory points inside the US boundary with the overlay operation, then
# plot the hurricane trajectory inside the US boundary