

This notebook will be used in the lab session for week 1 of the course and provides some hands-on experience applying the lessons to environmental science datasets. We will be using data from Wilks’ book on Statistical Methods for the Atmospheric Sciences.
Notebook Setup
# Common imports
import numpy as np
import os
import pandas as pd
import pooch


# to make this notebook's output stable across runs
rnd_seed = 42
rnd_gen = np.random.default_rng(rnd_seed)

# To plot pretty figures
%matplotlib inline
import matplotlib as mpl
import matplotlib.pyplot as plt
mpl.rc('axes', labelsize=14)
mpl.rc('xtick', labelsize=12)
mpl.rc('ytick', labelsize=12)

# Where to save the figures -- shared _files/ dir for this part's generated output
IMAGES_PATH = "_files"
os.makedirs(IMAGES_PATH, exist_ok=True)

def save_fig(fig_id, tight_layout=True, fig_extension="png", resolution=300):
    path = os.path.join(IMAGES_PATH, fig_id + "." + fig_extension)
    print("Saving figure", fig_id)
    if tight_layout:
        plt.tight_layout()
    plt.savefig(path, format=fig_extension, dpi=resolution)
Let’s begin by loading relevant data from the cloud.
# Load Wilks' Table A-3 from a verified snapshot in this book's data repository
csv_path = "https://raw.githubusercontent.com/gse-unil/2026_MLEES_book/main/data/part-II/wilks_table_a3.csv"
csv_hash = "sha256:c158828a1bdf1aa521c61321842352cb1674e49187e21c504188ab976d3a41f2"
csv_file = pooch.retrieve(csv_path, known_hash=csv_hash, fname="wilks_table_a3.csv", path=pooch.os_cache("mlees"))

A3_df = pd.read_csv(csv_file, index_col=0)
print("Here's a data sample. You can copy the row header text from here if you need it later 😉")
A3_df.head(5)
Here's a data sample. You can copy the row header text from here if you need it later 😉
Linear Regression
The goal for this exercise is to train a linear regression model and a logistic regression model to forecast atmospheric temperature using atmospheric pressure. 🌡
For the first case, we want to train linear regression to calculate June temperatures (the predictand) from June pressures (as the predictor) in Guayaquil, Ecuador.

Caption A beautiful day in Guayacil, Ecuador. Can you predict how hot it will be? 🌞
We can try addressing this question using a linear regression model from scikit.
Q1) Import the LinearRegression model. Instantiate it and fit it using the A3 dataframes’ pressure and temperature.
# Import the LinearRegression model
from _______._______ import _______
# Instantiate the model
lin_reg = _______()# Load and reshape the input data
pressure = _______['_______'].values.reshape(-1,1)# Load the truth data (i.e., the predictant)
temperature = _______['_______'].to_numpy().ravel()# Fit the model
lin_reg._______(_______, _______)We now have a linear regression model for the temperature and pressure. Let’s make some plots to visualize our data and get a qualitative sense of our model.
Q2) Generate a scatter plot with the linear regression plot for our data.
#Instantiate a figure having size 13,6
fig, ax = plt.subplots(_______=(_______,_______))

"""----------------------------------------------------------------------------
Let's start by plotting the data points from our dataset
----------------------------------------------------------------------------"""
# Set figure title and axis labels
fig._______('June Temperature vs Pressure  in Guayaquil, Ecuador')
ax._______("Pressure (mb)")
ax._______("Temperature (°C)")

# The colors and styles suggested below are not compulsory, but please avoid
# using the default settings.
# Make a scatter plot for the pressure (x) and temperature (y). Use color=black,
# marker size = 100, and set the marker style to '2'.

ax._______(_______, # X values
           _______, # y values
           _______=_______, # Color
           _______ = _______, # Marker size
           _______ = _______) # Marker style


'''----------------------------------------------------------------------------
Now, let's plot the line we fit to the datapoints
----------------------------------------------------------------------------'''
# Make a 100 point numpy array between 1008 and 1014 and store it in reg_x.
# Reshape it to (-1,1). Hint: numpy has a linear space generator
reg_x = _______._______(_______, # Start
                        _______, # Stop
                        _______,# Number of Points
                        ).reshape(_______,________) # Reshape to row=sample, col=feature

# Let's produce a set of predictions from our linear space array.
reg_y = lin_reg._______(reg_x)

# Let's plot the regression line using reg_x and reg_y. Set the color to red and
# the linewidth to 1.5
ax.plot(_______, # X
        _______, # y
        _______ = _______, # Color
        _______ = _______) # Linewidth

ax.autoscale(axis='x', tight=True)
We now have a qualitative verification of our model! Your figure should look similar to this one:
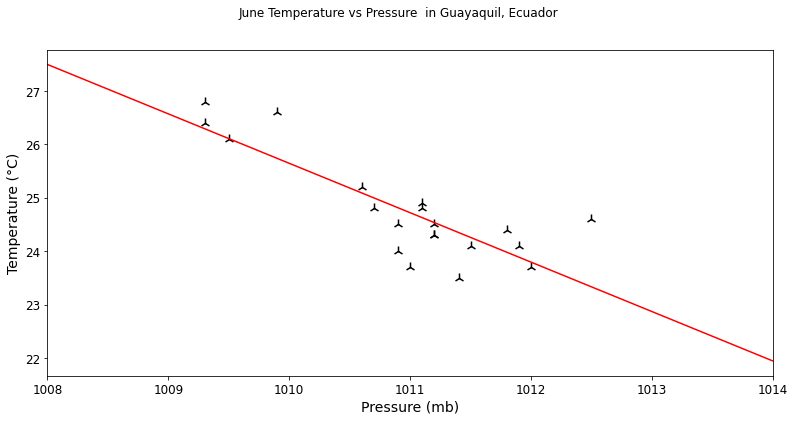
Qualitative verifications are nice - but this is not enough! Let’s do some quantitative analyses:
Q3) Print the slope of our model. Find the F-score, p-value, and statistics for our model.
# Fetch the slope directly from the linear model. Hint: check the attributes
# section of the linear regression model documentation on scikit.
slope = lin_reg._______
slope = float(slope)

# Calculate the F-score and p-value for our dataset.
# Hint: check the f_regression option in sklearn.feature_selection
from _______._______ import _______
fscore, pvalue = _______(_______, # X values
                         _______) # y values
fscore=float(fscore)
pvalue=float(pvalue)


# Fetch the R2 value from the lin_reg model. Hint: r2_score in sklearn metrics
predicted_temperatures = _______._______(_______)
from _______._______ import _______
R_squared = _______(_______, # Ground truth
                    _______) # Predictions
# Now we print out the results!
print(f'The slope of the line is: {slope:.2f}',
f'The f score is: {fscore:.0f}',
f'The R\u00b2 value is: {R_squared:.2f}',
sep='\n')If your code works just the way ours does, you’ll get:
The slope of the line is: -0.92
The f score is: 40
The R² value is: 0.69
Classification
Let’s use the same dataset to train a classifier for El Niño years. \
We will use the June temperature and pressure in Guayaquil as the predictors for El Niño. \
Let’s begin by setting up a training and testing dataset. Since the dataset is so small, we’ll set aside one each of a random El Niño year and a non-El Niño year for our test dataset, and the remaining points as our training dataset.
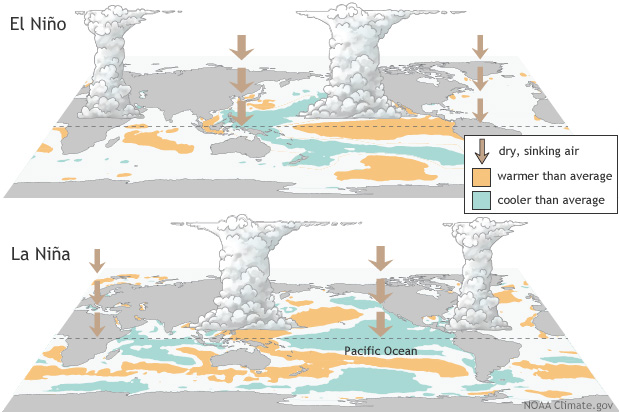
Source: NOAA “What is Enso?”
Caption: Can we predict whether we are in an El Niño phase based on June temperatures and pressures in Guayaquil, Ecuador?
# Let's make our train and test datasets
def test_train_split(df, rnd_gen):
    nino_years = df.loc[df['El Niño']==1].index.values
    not_nino_years = df.loc[df['El Niño']==0].index.values

    nino_idxs = rnd_gen.permutation(np.arange(0,nino_years.size))
    not_nino_idxs = rnd_gen.permutation(np.arange(0,not_nino_years.size))

    train = ( list(nino_years[nino_idxs[:-1]]) +
              list(not_nino_years[not_nino_idxs[:-1]]) )

    test = [nino_years[nino_idxs[-1]], not_nino_years[not_nino_idxs[-1]]]

    return (np.array(test), np.array(train))

# Use test_train_split to make the testing and training datasets
test, train = test_train_split(A3_df, rnd_gen)
print(f'Test years: {test}\n'
      f'Train years: {train}')
Test years: [1951 1958]
Train years: [1969 1957 1965 1953 1970 1963 1968 1961 1967 1964 1960 1962 1956 1952
1954 1959 1966 1955]
We’re going to train a logistic regression classifier on the dataset, but in this exercise we’ll rely on the scikit learn implementation!
Q4) Make the training and test datasets from the source data.
Hint 1: Scikit-learn’s LogisticRegression classifier is documented at this link.
Hint 2: Before training, use the dataframes’ .loc method with the test/train list, then convert the values to numpy (e.g., using this method) and .ravel() the truth if necessary. You can also do what was done in the previous section when handling single columns (i.e., using .values.reshape() on single column data).
A3_df.head(5)# Get the training and testing dataframes
train_df = A3_df._______[_______]
test_df = A3_df._______[_______]
# Extract the training inputs (X_train) and labels (y_train) from
# the training dataframe
X_train = _______[['_______','_______']]._______
y_train = _______[['_______']]._______()._______()
# Do the same with the testing dataframe
X_test = _______[['_______','_______']]._______
y_test = _______[['_______']]._______()._______()Q5) Import and instantiate the logistic regression classifier from scikit. Fit it using the training dataset.
# Import the LogisticRegression class from sklearn
from _______._______ import _______

# And instantiate the model
log_reg = _______()
# Fit the logistic regression to the training set
log_reg._______(_______, _______)That should hopefully have felt much simpler than our previous exercise. Now that you have a trained model, let’s see if our model is able to predict whether the test years are El Niño years!
Q6) Predict whether each of the two test years was an El Niño year using the logistic regression model, and print out the prediction alongside the truth.
Hint: To find which method of your LogisticRegression classifier to use to make predictions, don’t hesitate to consult its documentation at this link.
# Make predictions using our model!
prediction = log_reg._______(_______)
print(f'Was {test[0]} an El Niño year? {bool(y_test[0])}. We predicted {bool(prediction[0])}')
print(f'Was {test[1]} an El Niño year? {bool(y_test[1])}. We predicted {bool(prediction[1])}')If your code reproduces our exact results, you should get the following as a printout: \
Was 1951 an El Niño year? True. We predicted TrueWas 1958 an El Niño year? False. We predicted False
And with that, we’re done for the week! Take a moment to relax, or if you’re feeling up to a challenge go back and do the challenge questions for the other notebooks 😀